IMAX Corporation Reports First Quarter 2026 Results
-
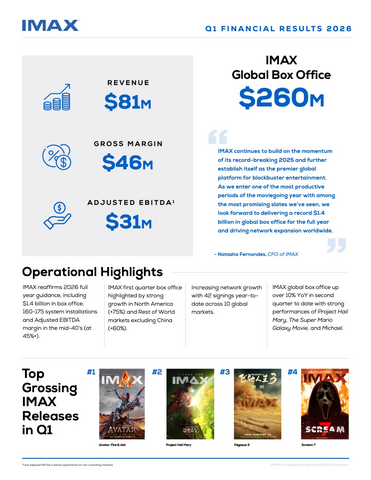
IMAX reaffirms 2026 full-year guidance, including
$1.4 billion in global box office – driven by a strong, diverse upcoming slate including Christopher Nolan’s The Odyssey, Dune: Part Three, The Mandalorian and Grogu, andNarnia among at least 14 Filmed For IMAX releases
- Bottom-line growth year-over-year underscores strong operating model, with increases across Net Income (+83%)(1), EPS (+75%)(1), Adjusted Net Income (+33%)(1)(2) and Adjusted EPS (+31%)(1)(2)
-
Project Hail Mary and Avatar: Fire and Ash lead IMAX to
$260 million in global box office in the first quarter, highlighted by +75% growth inNorth America and +60% growth in Rest of World excludingGreater China
-
Global network growth and diversification continue with agreements for 42 systems across 10 countries year to date, including largest IMAX agreement ever in
Australia and 7 signings to date inJapan
-
IMAX CEO
Rich Gelfond gradually resuming leadership duties and engaged in key strategic decision-making as he transitions from temporary medical leave
This press release features multimedia. View the full release here: https://www.businesswire.com/news/home/20260430812152/en/
Infographic highlighting IMAX's 1Q 2026 earnings results
“IMAX continues to build on the momentum of its record-breaking 2025 and further establish itself as the premier global platform for blockbuster entertainment. As we enter one of the most productive periods of the moviegoing year with among the most promising slates we’ve seen, we look forward to delivering a record
“The breakout success of Project Hail Mary – a Filmed For IMAX release that more than doubled our initial box office projections – demonstrates what a well-crafted blockbuster can achieve when it leans fully into the IMAX platform. We have several tentpoles this year from the most successful filmmakers in
“We continue to capitalize on our box office success – and renewed optimism among exhibitors given the industry’s strong start to 2026 – to further grow and diversify our global network. Our continued momentum in
IMAX CEO
| ____________________ | |
|
(1) |
Attributable to common shareholders. |
|
(2) |
Non-GAAP Financial Measure. See the discussion at the end of this earnings release for a description of the non-GAAP financial measures used herein, as well as reconciliations to the most comparable GAAP amounts. |
First Quarter Financial Highlights
|
|
Three Months Ended (Unaudited) |
|||||||||
|
In millions of |
|
2026 |
|
|
|
2025 |
|
|
YoY %
|
|
|
Total Revenue |
$ |
81.4 |
|
|
$ |
86.7 |
|
|
(6 |
%) |
|
|
|
|
|
|
|
|||||
|
Gross Margin |
$ |
45.8 |
|
|
$ |
53.2 |
|
|
(14 |
%) |
|
Gross Margin (%) |
|
56.3 |
% |
|
|
61.4 |
% |
|
(510bps) |
|
|
|
|
|
|
|
|
|||||
|
Net Income |
$ |
6.1 |
|
|
$ |
8.2 |
|
|
(26 |
%) |
|
Net Income Margin (%) |
|
7.5 |
% |
|
|
9.4 |
% |
|
(190bps) |
|
|
|
|
|
|
|
|
|||||
|
Net Income Attributable to Common Shareholders |
$ |
4.2 |
|
|
$ |
2.3 |
|
|
83 |
% |
|
Net Income Per Share - Diluted(1) |
$ |
0.07 |
|
|
$ |
0.04 |
|
|
75 |
% |
|
|
|
|
|
|
|
|||||
|
Total Adjusted EBITDA(2)(3) |
$ |
30.5 |
|
|
$ |
37.0 |
|
|
(18 |
%) |
|
Total Adjusted EBITDA Margin (%)(2)(3) |
|
37.5 |
% |
|
|
42.7 |
% |
|
(520bps) |
|
|
|
|
|
|
|
|
|||||
|
Adjusted Net Income(1)(2) |
$ |
9.6 |
|
|
$ |
7.2 |
|
|
33 |
% |
|
Adjusted Earnings Per Share - Diluted(1)(2) |
$ |
0.17 |
|
|
$ |
0.13 |
|
|
31 |
% |
|
|
|
|
|
|
|
|||||
|
Weighted average shares outstanding (in millions): |
|
|
|
|
|
|||||
|
Basic |
|
54.1 |
|
|
|
53.1 |
|
|
2 |
% |
|
Diluted |
|
56.4 |
|
|
|
55.0 |
|
|
3 |
% |
| ____________________ | |
|
(1) |
Attributable to common shareholders. |
|
(2) |
Non-GAAP Financial Measure. See the discussion at the end of this earnings release for a description of the non-GAAP financial measures used herein, as well as reconciliations to the most comparable GAAP amounts. |
|
(3) |
Total Adjusted EBITDA is before adjustments for non-controlling interests. Total Adjusted EBITDA per Credit Facility attributable to common shareholders, excluding non-controlling interests, was |
First Quarter Segment Results(1)
|
|
Content Solutions |
|
Technology Products and Services |
||||||||||||||||||
|
|
Revenue |
|
Gross Margin |
|
Gross Margin % |
|
Revenue |
|
Gross Margin |
|
Gross Margin % |
||||||||||
|
1Q26 |
$ |
31.4 |
|
|
$ |
18.3 |
|
|
58 |
% |
|
$ |
48.3 |
|
|
$ |
26.9 |
|
|
56 |
% |
|
1Q25 |
|
34.2 |
|
|
|
23.6 |
|
|
69 |
% |
|
|
50.6 |
|
|
|
29.1 |
|
|
57 |
% |
|
% change |
|
(8 |
%) |
|
|
(22 |
%) |
|
|
|
|
(4 |
%) |
|
|
(8 |
%) |
|
|
||
| ____________________ | |
|
(1) |
Please refer to the Company’s Quarterly Report on Form 10Q for the period ended |
Content Solutions Segment
-
First quarter Content Solutions revenues and gross margin decreased 8% to
$31 million and 22% to$18 million year-over-year, respectively, driven by lower box office inChina partially offset by strong growth of 67% outside ofGreater China . Greater China’s box office was impacted by the combination of the recordChinese New Year in the 2025 comparative period and with the shift of two larger Chinese local language titles now expected later in 2026.
-
First quarter global box office of
$260 million decreased 13% year-over-year driven by lower box office fromChinese New Year films compared to the first quarter of 2025 whenNe Zha 2 grossed a record$161 million . Top grossing first quarter titles included Avatar: Fire and Ash ($77 million ), Project Hail Mary ($66 million ), and Pegasus 3 ($34 million ).
Technology Products and Services Segment
-
First quarter Technology Products and Services revenues and gross margin decreased 4% to
$48 million and 8% to$27 million year-over-year, respectively, driven by lowerGreater China box office related rental revenues.
- During the first quarter of 2026, the Company installed 19 systems compared to 21 systems in the first quarter of 2025. Of the 2026 installs, 8 systems were under sales arrangements, compared to 14 in the prior year.
-
Commercial network growth continued with the number of IMAX locations reaching 1,798 systems as of
March 31, 2026 compared to 1,738 systems as ofMarch 31, 2025 . The Company ended Q1 2026 with a backlog of 435 IMAX systems.
Operating Cash Flow and Liquidity
Net cash provided by operating activities was
As of
In 2025, the Company issued
Share Count and Capital Return
The weighted average basic and diluted shares outstanding in the first quarter of 2026 were 54.1 million and 56.4 million, respectively, compared to 53.1 million and 55.0 million in the first quarter of 2025.
During the first quarter, the Company did not repurchase any common shares.
In
Supplemental Materials
For more information about the Company’s results, please refer to the IMAX Investor Relations website located at investors.imax.com.
Investor Relations Website
On a monthly basis, the Company posts quarter-to-date box office results on the IMAX Investor Relations website located at investors.imax.com. The Company expects to provide such updates within five business days of month-end, although the Company may change this timing without notice.
The Company may post additional information on the Company’s corporate and Investor Relations websites, which may be material to investors. Accordingly, investors, media and others interested in the Company should monitor the Company’s website in addition to the Company’s press releases,
Conference Call
The Company will host a conference call today at
About
IMAX, an innovator in entertainment technology, combines proprietary software, architecture, and equipment to create experiences that take you beyond the edge of your seat to a world you’ve never imagined. Top filmmakers and studios are utilizing IMAX systems to connect with audiences in extraordinary ways, making IMAX’s network among the most important and successful theatrical distribution platforms for major event films around the globe.
IMAX’s principal executive offices are located in
Shares of IMAX China Holding, Inc., a subsidiary of
IMAX®, IMAX® 3D, Experience It In IMAX®, The IMAX Experience®, DMR®, Filmed For IMAX®, IMAX Live®, and IMAX Enhanced® are trademarks and trade names of the Company or its subsidiaries that are registered or otherwise protected under laws of various jurisdictions. For more information, visit www.imax.com. You can also connect with IMAX on Instagram (www.instagram.com/imax), Facebook (www.facebook.com/imax), LinkedIn (www.linkedin.com/company/imax), X (www.twitter.com/imax), and YouTube (www.youtube.com/imaxmovies).
Forward-Looking Statements
This earnings release contains forward looking statements that are based on
These forward-looking statements include, but are not limited to statements regarding: the Company’s business and technology strategies and measures to implement such strategies; the Company’s competitive strengths, differentiation, goals, market opportunity and penetration, including opportunities in and expected growth from international markets, momentum and runway for expansion and growth of business, networks, operations and technology; capital allocation, including with respect to share repurchase programs; the Company’s technological capabilities and the differentiation thereof; future releases of films and other content to the IMAX network, including the timing of such releases, the anticipated box office revenues, and other effects thereof; plans and references to the future success of the Company and expectations regarding its future operating, financial and technological results, including its box office guidance for 2026; and the Company’s management and leadership during its Chief Executive Officer’s temporary medical leave of absence and the timing thereof.
These forward-looking statements are based on certain assumptions and analyses made by the Company in light of its experience and its perception of historical trends, current conditions and expected future developments, as well as other factors it believes are appropriate in the circumstances. However, whether actual results and developments will conform with the expectations and predictions of the Company is subject to a number of risks and uncertainties, including, but not limited to: risks associated with the Company’s investments, operations, and future expansion in foreign jurisdictions, including the impact of economic, political and regulatory policies and laws of
IMAX Network and Backlog
|
|
Three Months Ended |
||
|
|
|
||
|
|
2026 |
|
2025 |
|
System Signings(1): |
|
|
|
|
Sales Arrangements |
21 |
|
19 |
|
Traditional JRSA(2) |
2 |
|
76 |
|
Total IMAX System Signings |
23 |
|
95 |
|
|
|
|
|
|
(1) System signings include new signings of 10 in Q1 2026 and 37 in Q1 2025.
(2) Includes 70 traditional JRSA systems with |
|||
|
|
Three Months Ended |
||
|
|
|
||
|
|
2026 |
|
2025 |
|
System Installations(1): |
|
|
|
|
Sales Arrangements |
8 |
|
13 |
|
Traditional JRSA |
11 |
|
8 |
|
Total IMAX System Installations |
19 |
|
21 |
|
|
|
|
|
|
(1) System installations include new systems installations of 8 in Q1 2026 and 14 in Q1 2025. |
|||
|
|
As of |
||
|
|
2026 |
|
2025 |
|
System Backlog: |
|
|
|
|
Sales Arrangements |
180 |
|
170 |
|
Hybrid JRSA |
61 |
|
94 |
|
Traditional JRSA |
194 |
|
252 |
|
Total System Backlog |
435 |
|
516 |
|
|
|
|
|
|
|
|
|
|
|
|
As of |
||
|
|
2026 |
|
2025 |
|
System Network: |
|
|
|
|
Commercial Multiplex Systems |
|
|
|
|
Sales Arrangements |
917 |
|
845 |
|
Hybrid JRSA |
84 |
|
121 |
|
Traditional JRSA |
797 |
|
772 |
|
Total Commercial Multiplex Systems |
1,798 |
|
1,738 |
|
Commercial Destination Systems |
10 |
|
11 |
|
Institutional Systems |
57 |
|
61 |
|
Total System Network |
1,865 |
|
1,810 |
|
CONDENSED CONSOLIDATED STATEMENTS OF OPERATIONS
(In thousands of (Unaudited) |
|||||||
|
|
Three Months Ended
|
||||||
|
|
|
2026 |
|
|
|
2025 |
|
|
Revenues |
|
|
|
||||
|
Technology sales |
$ |
13,414 |
|
|
$ |
13,524 |
|
|
Image enhancement and maintenance services |
|
48,584 |
|
|
|
50,753 |
|
|
Technology rentals |
|
16,624 |
|
|
|
19,311 |
|
|
Finance income |
|
2,757 |
|
|
|
3,079 |
|
|
|
|
81,379 |
|
|
|
86,667 |
|
|
Costs and expenses applicable to revenues |
|
|
|
||||
|
Technology sales |
|
5,556 |
|
|
|
7,223 |
|
|
Image enhancement and maintenance services |
|
22,936 |
|
|
|
19,445 |
|
|
Technology rentals |
|
7,076 |
|
|
|
6,823 |
|
|
|
|
35,568 |
|
|
|
33,491 |
|
|
Gross margin |
|
45,811 |
|
|
|
53,176 |
|
|
Selling, general and administrative expenses |
|
32,488 |
|
|
|
33,462 |
|
|
Research and development |
|
1,804 |
|
|
|
1,318 |
|
|
Amortization of intangible assets |
|
2,028 |
|
|
|
1,731 |
|
|
Credit loss reversal, net |
|
(460 |
) |
|
|
(126 |
) |
|
Restructuring charges and other impairments |
|
— |
|
|
|
57 |
|
|
Income from operations |
|
9,951 |
|
|
|
16,734 |
|
|
Realized and unrealized investment gains |
|
36 |
|
|
|
32 |
|
|
Retirement benefits non-service expense |
|
(67 |
) |
|
|
(70 |
) |
|
Interest income |
|
468 |
|
|
|
540 |
|
|
Interest expense |
|
(1,896 |
) |
|
|
(1,801 |
) |
|
Income before taxes |
|
8,492 |
|
|
|
15,435 |
|
|
Income tax expense |
|
(2,421 |
) |
|
|
(7,285 |
) |
|
Net income |
|
6,071 |
|
|
|
8,150 |
|
|
Net income attributable to non-controlling interests |
|
(1,845 |
) |
|
|
(5,823 |
) |
|
Net income attributable to common shareholders |
$ |
4,226 |
|
|
$ |
2,327 |
|
|
|
|
|
|
||||
|
Net income per share attributable to common shareholders: |
|
|
|
||||
|
Basic |
$ |
0.08 |
|
|
$ |
0.04 |
|
|
Diluted |
$ |
0.07 |
|
|
$ |
0.04 |
|
|
|
|
|
|
||||
|
Weighted average shares outstanding (in thousands): |
|
|
|
||||
|
Basic |
|
54,125 |
|
|
|
53,145 |
|
|
Diluted |
|
56,392 |
|
|
|
54,969 |
|
|
|
|
|
|
||||
|
Additional Disclosure: |
|
|
|
||||
|
Depreciation and amortization |
$ |
15,236 |
|
|
$ |
14,913 |
|
|
Amortization of deferred financing costs |
$ |
528 |
|
|
$ |
492 |
|
|
CONDENSED CONSOLIDATED BALANCE SHEETS
(In thousands of (Unaudited) |
|||||||
|
|
|
|
|
||||
|
Assets |
|
|
|
||||
|
Cash and cash equivalents |
$ |
145,995 |
|
|
$ |
151,168 |
|
|
Accounts receivable, net of allowance for credit losses |
|
108,540 |
|
|
|
108,079 |
|
|
Financing receivables, net of allowance for credit losses |
|
121,325 |
|
|
|
121,954 |
|
|
Variable consideration receivables, net of allowance for credit losses |
|
90,624 |
|
|
|
91,402 |
|
|
Inventories |
|
35,823 |
|
|
|
32,505 |
|
|
Prepaid expenses |
|
16,663 |
|
|
|
14,881 |
|
|
Film assets, net of accumulated amortization |
|
16,638 |
|
|
|
15,529 |
|
|
Property, plant and equipment, net of accumulated depreciation |
|
240,890 |
|
|
|
242,910 |
|
|
Lease incentives and other assets |
|
27,240 |
|
|
|
24,820 |
|
|
Deferred income tax assets, net of valuation allowance |
|
12,675 |
|
|
|
12,577 |
|
|
|
|
45,815 |
|
|
|
45,815 |
|
|
Other intangible assets, net of accumulated amortization |
|
30,923 |
|
|
|
32,391 |
|
|
Total assets |
$ |
893,151 |
|
|
$ |
894,031 |
|
|
Liabilities |
|
|
|
||||
|
Accounts payable |
$ |
17,193 |
|
|
$ |
19,478 |
|
|
Accrued and other liabilities |
|
88,138 |
|
|
|
105,293 |
|
|
Deferred revenue |
|
56,132 |
|
|
|
50,395 |
|
|
Revolving credit facility borrowings, net of unamortized debt issuance costs |
|
46,702 |
|
|
|
34,577 |
|
|
Convertible notes and other borrowings, net of unamortized discounts and debt issuance costs |
|
244,128 |
|
|
|
244,034 |
|
|
Deferred income tax liabilities |
|
12,521 |
|
|
|
12,521 |
|
|
Total liabilities |
|
464,814 |
|
|
|
466,298 |
|
|
Commitments, contingencies and guarantees |
|
|
|
||||
|
Non-controlling interests |
|
691 |
|
|
|
666 |
|
|
Shareholders’ equity |
|
|
|
||||
|
Capital stock common shares – no par value. Authorized – Unlimited number. 54,855,176 issued and outstanding ( |
|
429,650 |
|
|
|
419,162 |
|
|
Other equity |
|
145,998 |
|
|
|
164,782 |
|
|
Statutory surplus reserve |
|
4,219 |
|
|
|
4,219 |
|
|
Accumulated deficit |
|
(235,741 |
) |
|
|
(239,967 |
) |
|
Accumulated other comprehensive loss |
|
(8,664 |
) |
|
|
(10,305 |
) |
|
Total shareholders’ equity attributable to common shareholders |
|
335,462 |
|
|
|
337,891 |
|
|
Non-controlling interests |
|
92,184 |
|
|
|
89,176 |
|
|
Total shareholders’ equity |
|
427,646 |
|
|
|
427,067 |
|
|
Total liabilities and shareholders’ equity |
$ |
893,151 |
|
|
$ |
894,031 |
|
|
CONDENSED CONSOLIDATED STATEMENTS OF CASH FLOWS
(In thousands of (Unaudited) |
|||||||
|
|
Three Months Ended
|
||||||
|
|
|
2026 |
|
|
|
2025 |
|
|
Operating Activities |
|
|
|
||||
|
Net income |
$ |
6,071 |
|
|
$ |
8,150 |
|
|
Adjustments to reconcile net income to cash provided by operating activities: |
|
|
|
||||
|
Depreciation and amortization |
|
15,236 |
|
|
|
14,913 |
|
|
Amortization of deferred financing costs |
|
528 |
|
|
|
492 |
|
|
Credit loss reversal, net |
|
(460 |
) |
|
|
(126 |
) |
|
Write-downs, including asset impairments |
|
57 |
|
|
|
193 |
|
|
Deferred income tax recovery |
|
(35 |
) |
|
|
— |
|
|
Share-based and other non-cash compensation |
|
5,792 |
|
|
|
5,275 |
|
|
Unrealized foreign currency exchange loss |
|
83 |
|
|
|
289 |
|
|
Realized and unrealized investment gain |
|
(36 |
) |
|
|
(32 |
) |
|
Changes in assets and liabilities: |
|
|
|
||||
|
Accounts receivable |
|
(751 |
) |
|
|
(15,014 |
) |
|
Inventories |
|
(3,355 |
) |
|
|
1,032 |
|
|
Film assets |
|
(5,353 |
) |
|
|
(7,396 |
) |
|
Lease incentives provided to exhibitor customers |
|
(8,671 |
) |
|
|
(1,029 |
) |
|
Deferred revenue |
|
5,769 |
|
|
|
1,390 |
|
|
Changes in other operating assets and liabilities |
|
(10,846 |
) |
|
|
(1,186 |
) |
|
Net cash provided by operating activities |
|
4,029 |
|
|
|
6,951 |
|
|
Investing Activities |
|
|
|
||||
|
Purchase of property, plant and equipment |
|
(2,132 |
) |
|
|
(1,645 |
) |
|
Investment in equipment for joint revenue sharing arrangements |
|
(4,003 |
) |
|
|
(11,746 |
) |
|
Acquisition of other intangible assets |
|
(792 |
) |
|
|
(1,233 |
) |
|
Net cash used in investing activities |
|
(6,927 |
) |
|
|
(14,624 |
) |
|
Financing Activities |
|
|
|
||||
|
Revolving credit facility borrowings |
|
31,000 |
|
|
|
23,000 |
|
|
Repayments of revolving credit facility borrowings |
|
(19,000 |
) |
|
|
(10,000 |
) |
|
Debt issuance costs related to convertible notes |
|
(944 |
) |
|
|
— |
|
|
Credit facility amendment fees paid |
|
(9 |
) |
|
|
— |
|
|
Repayments of other borrowings |
|
(164 |
) |
|
|
(209 |
) |
|
Taxes withheld and paid on employee stock awards vested |
|
(17,451 |
) |
|
|
(9,505 |
) |
|
Common shares issued - stock options exercised |
|
3,806 |
|
|
|
948 |
|
|
Net cash (used in) provided by financing activities |
|
(2,762 |
) |
|
|
4,234 |
|
|
Effects of exchange rate changes on cash |
|
487 |
|
|
|
(84 |
) |
|
Decrease in cash and cash equivalents during period |
|
(5,173 |
) |
|
|
(3,523 |
) |
|
Cash and cash equivalents, beginning of period |
|
151,168 |
|
|
|
100,592 |
|
|
Cash and cash equivalents, end of period |
$ |
145,995 |
|
|
$ |
97,069 |
|
Primary Reporting Groups
The Company’s Chief Executive Officer (“CEO”) is its Chief Operating Decision Maker (“CODM”), as such term is defined under
The Company has two reportable segments:
-
Content Solutions, consists of services provided to studios and other content creators, which principally includes the digital remastering of films and other content into IMAX formats for distribution to the IMAX network. To a lesser extent, the Content Solutions segment also earns revenue from the distribution of large-format documentary films and exclusive experiences ranging from live performances to interactive events with leading artists and creators, as well as film post-production services.
- Technology Products and Services, which includes results from the sale or lease of IMAX Systems, as well as from the maintenance of IMAX Systems to exhibition customers. To a lesser extent, the Technology Product and Services segment also earns revenue from certain ancillary theater business activities, including after-market sales of IMAX System parts and 3D glasses.
Segment Revenue and Gross Margin
|
|
Three Months Ended (Unaudited) |
||||
|
(In thousands of |
2026 |
|
2025 |
||
|
Revenue |
|
|
|
||
|
Content Solutions |
$ |
31,370 |
|
$ |
34,249 |
|
Technology Products and Services |
|
48,338 |
|
|
50,593 |
|
Sub-total for reportable segments |
|
79,708 |
|
|
84,842 |
|
All Other(1) |
|
1,671 |
|
|
1,825 |
|
Total |
$ |
81,379 |
|
$ |
86,667 |
|
|
|
|
|
||
|
Gross Margin |
|
|
|
||
|
Content Solutions |
$ |
18,320 |
|
$ |
23,554 |
|
Technology Products and Services |
|
26,882 |
|
|
29,086 |
|
Sub-total for reportable segments |
|
45,202 |
|
|
52,640 |
|
All Other(1) |
|
609 |
|
|
536 |
|
Total |
$ |
45,811 |
|
$ |
53,176 |
|
___________________ (1) All Other includes the results from the Company’s Streaming and Consumer Technology business, as well as other ancillary activities. |
|||||
NON-GAAP FINANCIAL MEASURES
In this release, the Company presents adjusted net income attributable to common shareholders and adjusted net income attributable to common shareholders per basic and diluted share, EBITDA, Adjusted EBITDA per Credit Facility, Adjusted EBITDA margin and free cash flow as supplemental measures of the Company’s performance, which are not recognized under
A reconciliation from net income (loss) attributable to common shareholders and the associated per share amounts to adjusted net income attributable to common shareholders and adjusted net income attributable to common shareholders per diluted share is presented in the table below. Net income (loss) attributable to common shareholders and the associated per share amounts are the most directly comparable
Adjusted net income or loss attributable to common shareholders and adjusted net income or loss attributable to common shareholders per basic and diluted share exclude, where applicable: (i) share-based compensation; (ii) realized and unrealized investment gains or losses; (iii) goodwill impairment; (iv) restructuring charges and other impairments; (v) employee retention credits; and (vi) induced conversion expense on settlement of convertible notes; as well as the related tax impact of these adjustments.
The Company believes that these non-GAAP financial measures are important supplemental measures that allow management and users of the Company’s financial statements to view operating trends and analyze controllable operating performance on a comparable basis between periods without the after-tax impact of share-based compensation and certain unusual items included in net income attributable to common shareholders. Although share-based compensation is an important aspect of the Company’s employee and executive compensation packages, it is a non-cash expense and is excluded from certain internal business performance measures.
In addition to the non-GAAP financial measures discussed above, management also uses “EBITDA,” as such term is defined in the Credit Agreement, and which is referred to herein as “Adjusted EBITDA per Credit Facility” as well as “Adjusted EBITDA margin.” As defined in the Credit Agreement, Adjusted EBITDA per Credit Facility includes adjustments in addition to the exclusion of interest, taxes, depreciation and amortization. Accordingly, this non-GAAP financial measure is presented to allow a more comprehensive analysis of the Company’s operating performance and to provide additional information with respect to the Company’s compliance with its Credit Agreement requirements, when applicable. In addition, the Company believes that Adjusted EBITDA per Credit Facility and Adjusted EBITDA margin present relevant and useful information widely used by analysts, investors and other interested parties in the Company’s industry to evaluate, assess and benchmark the Company’s results.
EBITDA is defined as net income or loss excluding: (i) income tax expense or benefit; (ii) interest expense, net of interest income; (iii) depreciation and amortization, including film asset amortization; and (iv) amortization of deferred financing costs. Total Adjusted EBITDA is defined as EBITDA excluding: (i) share-based and other non-cash compensation expense; (ii) realized and unrealized investment losses or gains; (iii) restructuring and other charges; (iv) write-downs, net of recoveries, including asset impairments and credit loss reversal and (v) induced conversion expense on settlement of convertible notes. Adjusted EBITDA per Credit Facility is defined as EBITDA excluding: (i) share-based and other non-cash compensation; (ii) realized and unrealized investment gains or losses; (iii) restructuring charges and other impairments; (iv) write-downs, net of recoveries, including goodwill, asset impairments and credit loss expense or reversal and (v) induced conversion expense on settlement of convertible notes. Adjusted EBITDA Margin is defined as Adjusted EBITDA divided by revenue.
A reconciliation of net income (loss) attributable to common shareholders, which is the most directly comparable GAAP measure, to EBITDA, Adjusted EBITDA per Credit Facility and Adjusted EBITDA Margin is presented in the table below. Net income (loss) attributable to common shareholders is the most directly comparable
In this release, the Company also presents free cash flow, which is not recognized under
Adjusted EBITDA per Credit Facility
|
|
Three Months Ended (Unaudited) |
||||||
|
(In thousands of |
|
|
|
||||
|
Revenues |
$ |
81,379 |
|
|
$ |
86,667 |
|
|
Net income |
$ |
6,071 |
|
|
$ |
8,150 |
|
|
Add (subtract): |
|
|
|
||||
|
Income tax expense |
|
2,421 |
|
|
|
7,285 |
|
|
Interest expense, net of interest income |
|
900 |
|
|
|
769 |
|
|
Depreciation and amortization, including film asset amortization |
|
15,236 |
|
|
|
14,913 |
|
|
Amortization of deferred financing costs(1) |
|
528 |
|
|
|
492 |
|
|
EBITDA |
$ |
25,156 |
|
|
$ |
31,609 |
|
|
Share-based and other non-cash compensation |
|
5,792 |
|
|
|
5,275 |
|
|
Unrealized investment gains |
|
(36 |
) |
|
|
(32 |
) |
|
Restructuring charges and other impairments |
|
— |
|
|
|
57 |
|
|
Write-downs, including asset impairments and credit loss (expense) reversal |
|
(403 |
) |
|
|
66 |
|
|
Total Adjusted EBITDA |
$ |
30,509 |
|
|
$ |
36,975 |
|
|
Less: Non-controlling interest |
|
(3,700 |
) |
|
|
(8,926 |
) |
|
Adjusted EBITDA per Credit Facility - attributable to common shareholders |
$ |
26,809 |
|
|
$ |
28,049 |
|
|
__________________ (1) The amortization of deferred financing costs is recorded within Interest Expense in the Condensed Consolidated Statement of Operations. |
|||||||
Adjusted EBITDA per Credit Facility
|
|
Twelve Months Ended (Unaudited) |
||||||
|
(In thousands of |
|
|
|
||||
|
Revenues |
$ |
404,924 |
|
|
$ |
359,752 |
|
|
Net income |
|
43,447 |
|
|
$ |
35,432 |
|
|
Add (subtract): |
|
|
|
||||
|
Income tax expense |
|
12,903 |
|
|
|
7,122 |
|
|
Interest expense, net of interest income |
|
2,708 |
|
|
|
3,787 |
|
|
Depreciation and amortization, including film asset amortization |
|
62,769 |
|
|
|
65,252 |
|
|
Amortization of deferred financing costs(1) |
|
2,020 |
|
|
|
1,969 |
|
|
EBITDA |
$ |
123,847 |
|
|
$ |
113,562 |
|
|
Share-based and other non-cash compensation |
|
27,342 |
|
|
|
23,700 |
|
|
Unrealized investment losses (gains) |
|
863 |
|
|
|
(129 |
) |
|
Restructuring charges and other impairments |
|
2,421 |
|
|
|
3,806 |
|
|
Write-downs, including goodwill, asset impairments and credit loss expense |
|
8,742 |
|
|
|
2,921 |
|
|
Induced conversion expense on settlement of convertible notes |
|
15,264 |
|
|
|
— |
|
|
Total Adjusted EBITDA |
$ |
178,479 |
|
|
$ |
143,860 |
|
|
Less: Non-controlling interest |
|
(13,967 |
) |
|
|
(19,183 |
) |
|
Adjusted EBITDA per Credit Facility - attributable to common shareholders |
$ |
164,512 |
|
|
$ |
124,677 |
|
|
___________________ (1) The amortization of deferred financing costs is recorded within Interest Expense in the Condensed Consolidated Statement of Operations. |
|||||||
Adjusted Net Income Attributable to Common Shareholders and Adjusted Net Income Per Share
|
|
Three Months Ended (Unaudited) |
||||||||||||||
|
|
2026 |
|
2025 |
||||||||||||
|
(In thousands of |
Net Income |
|
Per Diluted Share |
|
Net Income |
|
Per Diluted Share |
||||||||
|
Net income attributable to common shareholders |
$ |
4,226 |
|
|
$ |
0.07 |
|
|
$ |
2,327 |
|
|
$ |
0.04 |
|
|
Adjustments(1): |
|
|
|
|
|
|
|
||||||||
|
Share-based compensation |
|
5,807 |
|
|
|
0.11 |
|
|
|
5,212 |
|
|
|
0.10 |
|
|
Unrealized investment gains |
|
(36 |
) |
|
|
— |
|
|
|
(32 |
) |
|
|
— |
|
|
Restructuring charges and other impairments |
|
— |
|
|
|
— |
|
|
|
57 |
|
|
|
— |
|
|
Tax impact on items listed above |
|
(429 |
) |
|
|
(0.01 |
) |
|
|
(386 |
) |
|
|
(0.01 |
) |
|
Adjusted net income(1) |
$ |
9,568 |
|
|
$ |
0.17 |
|
|
$ |
7,178 |
|
|
$ |
0.13 |
|
|
|
|
|
|
|
|
|
|
||||||||
|
Weighted average shares outstanding (in thousands): |
|
|
|
|
|
|
|
||||||||
|
Basic |
|
|
|
54,125 |
|
|
|
|
|
53,145 |
|
||||
|
Diluted |
|
|
|
56,392 |
|
|
|
|
|
54,969 |
|
||||
| ____________________ (1) Reflects amounts attributable to common shareholders. |
|||||||||||||||
Free Cash Flow
|
|
Three Months Ended (Unaudited) |
||||||
|
(In thousands of |
|
2026 |
|
|
|
2025 |
|
|
Net cash provided by operating activities |
$ |
4,029 |
|
|
$ |
6,951 |
|
|
Purchase of property, plant and equipment |
|
(2,132 |
) |
|
|
(1,645 |
) |
|
Acquisition of other intangible assets |
|
(792 |
) |
|
|
(1,233 |
) |
|
Free cash flow before growth CAPEX(1) |
|
1,105 |
|
|
|
4,073 |
|
|
Investment in equipment for joint revenue sharing arrangements |
|
(4,003 |
) |
|
|
(11,746 |
) |
|
Free cash flow |
$ |
(2,898 |
) |
|
$ |
(7,673 |
) |
| ____________________ (1) Growth CAPEX is defined as capital expenditures associated with investments in equipment for joint revenue sharing arrangements. |
|||||||
View source version on businesswire.com: https://www.businesswire.com/news/home/20260430812152/en/
Investors:
212-821-0154
jhorsley@imax.com
Media:
212-821-0102
mjafar@imax.com
Source: IMAX